Metrics API with Grafana Cloud
Grafana Cloud gives you a fully managed Prometheus endpoint plus hosted Grafana dashboards, which makes it the fastest way to explore the Supabase Metrics API without operating your own infrastructure.
Installation#
The Grafana Cloud integration is available in the Supabase Dashboard. Add the integration and select a project to get a fully-configured instance in one click: authentication, metric scraping, and a pre-built dashboard tracking 200+ metrics, set up automatically.
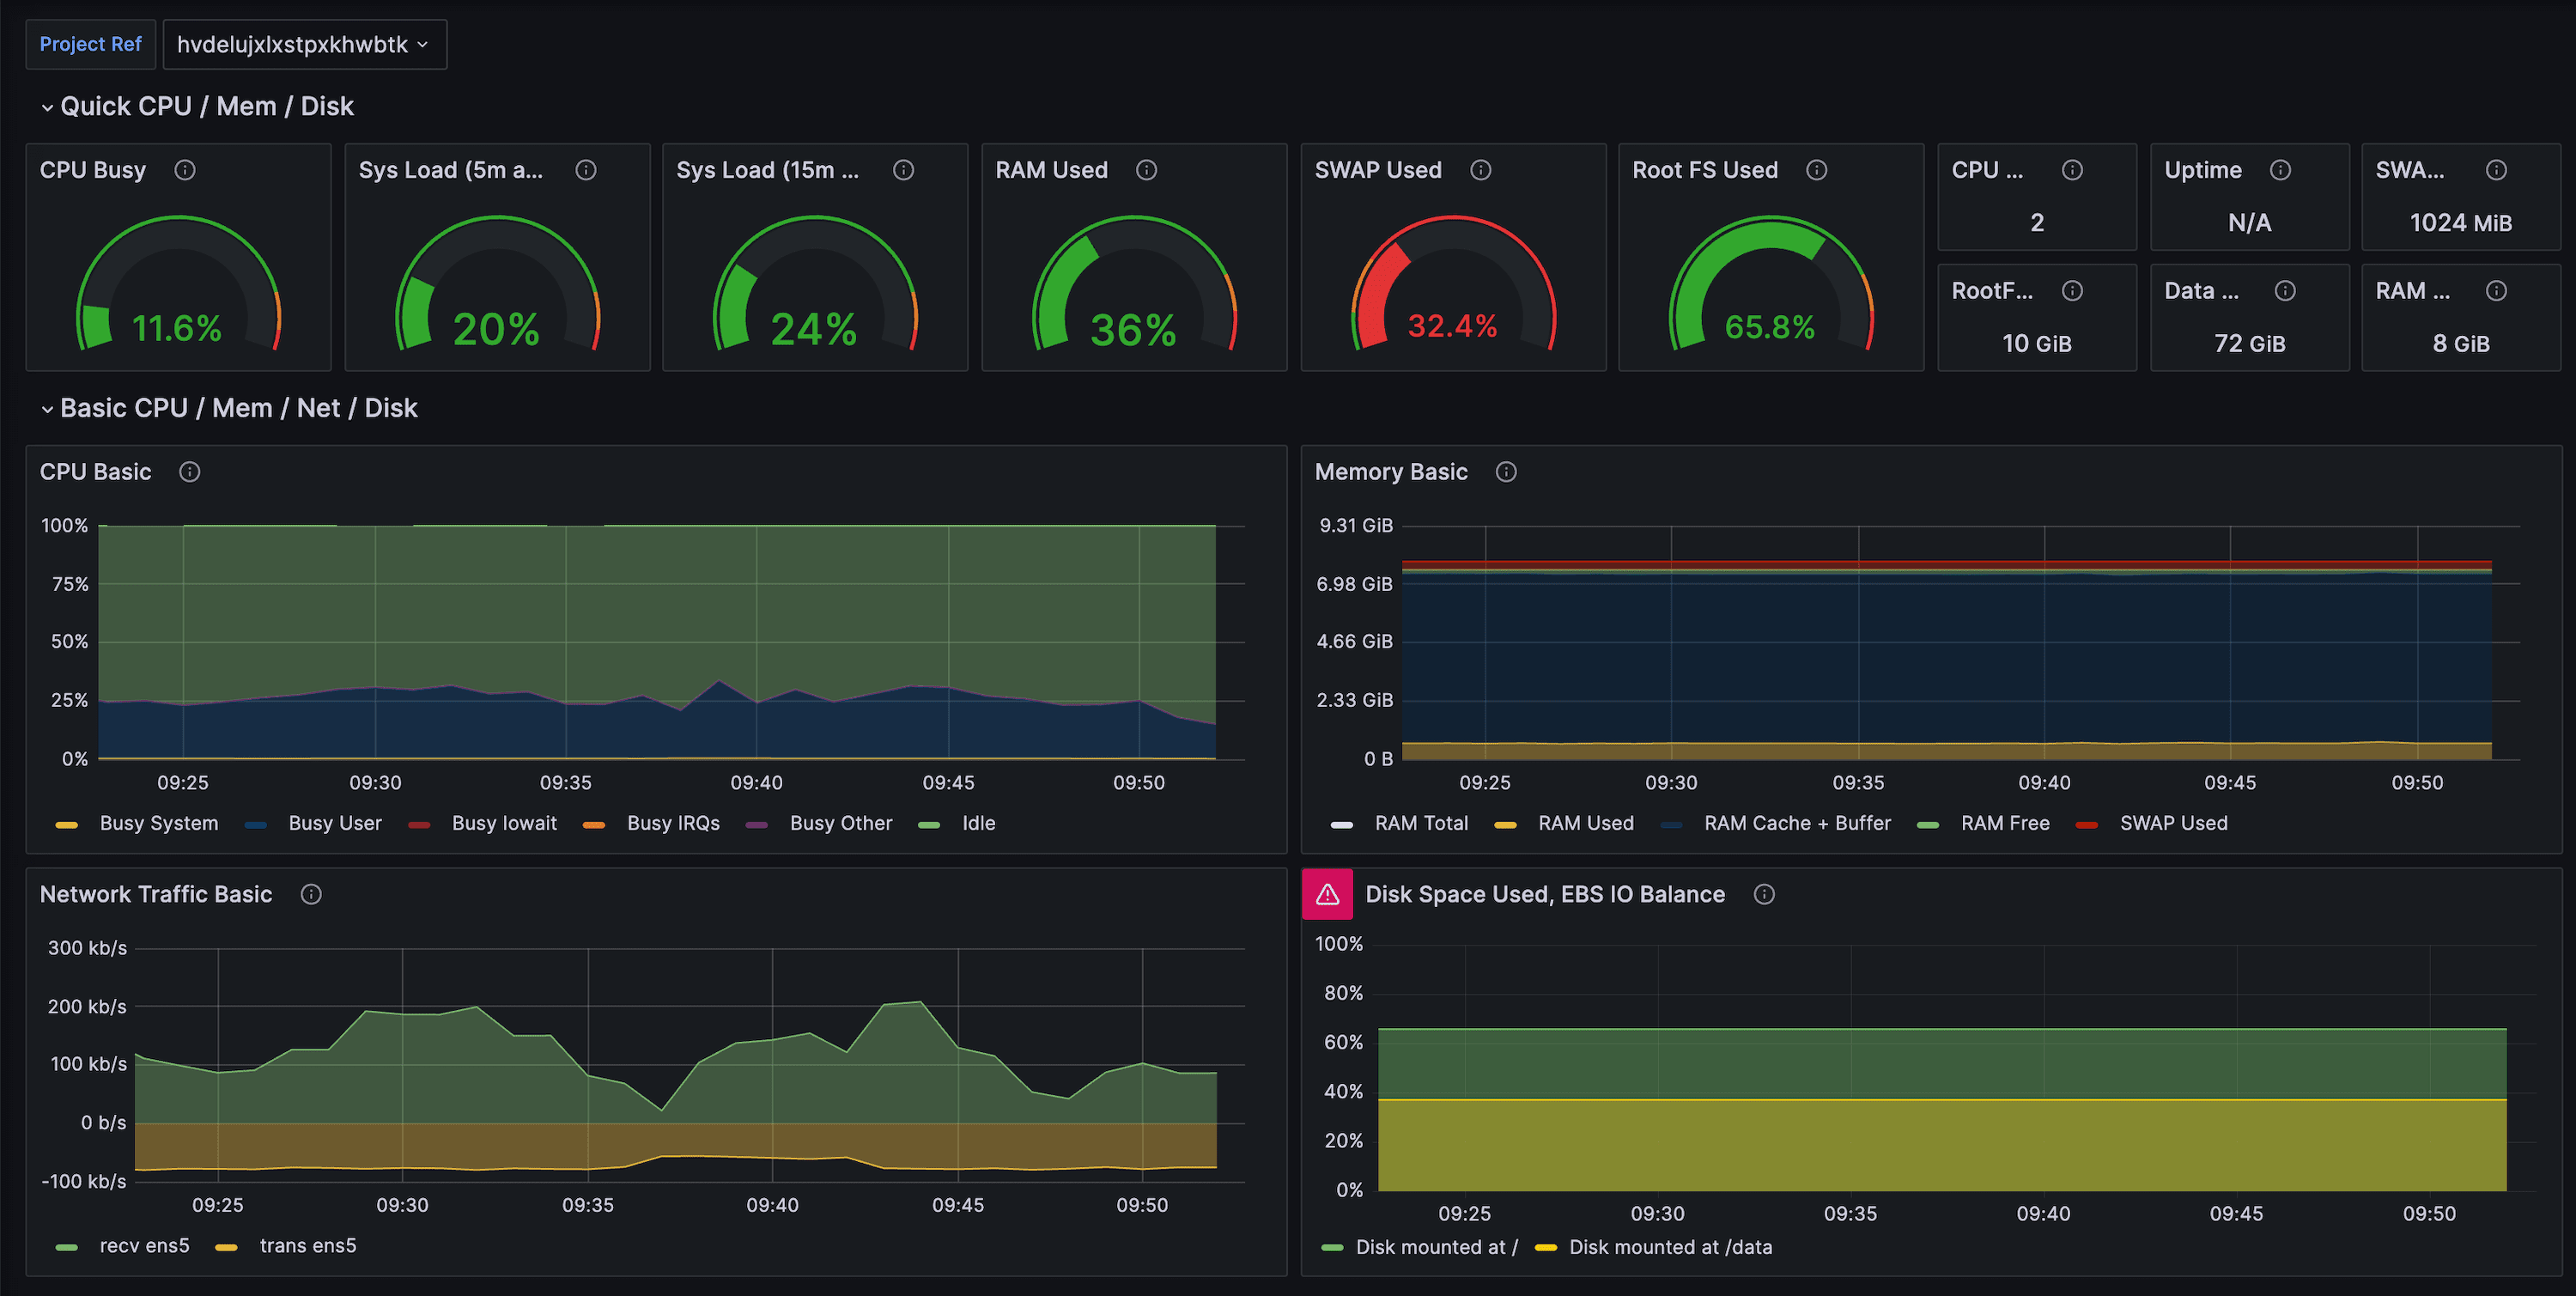
By integrating Supabase with Grafana Cloud, users gain monitoring capabilities for Supabase performance and operations. The included dashboard offers a comprehensive overview of Supabase performance, supplemented with Postgres metrics.
Manual setup#
The Grafana Cloud integration available in the Supabase Dashboard is the recommended path. You can still configure and run the setup manually by following the steps below.
Use this guide only if you need full manual control (custom scrape topology, self-hosted Prometheus or non-standard auth).
Prerequisites#
- A Supabase project with access to the Metrics API (Secret API key
sb_secret_...). - A Grafana Cloud account with Prometheus metrics enabled (Free or Pro tier).
- A Grafana API token with the
metrics:writeandmetrics:readscopes if you plan to push data manually.
1. Create a Grafana Cloud stack#
- Sign in to Grafana Cloud.
- Create or select a stack that has Prometheus Metrics enabled.
2. Install the Supabase integration for Grafana Cloud#
- In your Grafana Cloud stack, click Connections in the left-hand menu.
- Select the Supabase integration and follow the steps outlined on the Configuration page:
- Give your scrape job a descriptive name like
production-eu-central-1. - Set your Project ID and enter the service account API key.
- Test the connection and save the scrape job.
- Once scrape jobs are configured, click Install to add the prebuilt dashboards to your Grafana Cloud instance.
3. Configure the Supabase integration#
- Navigate to Connections → Add new connection → Supabase inside Grafana Cloud.
- Provide:
- Your Supabase project ref (e.g.
abcd1234). - The Metrics API endpoint (e.g.
https://<project-ref>.supabase.co/customer/v1/privileged/metrics). - HTTP Basic Auth credentials (
sb_secret_...).
- Your Supabase project ref (e.g.
- Choose the scrape interval. 1 minute is recommended, and test the connection. Grafana Cloud will deploy an agent in the background that scrapes the Metrics API and forwards the data to Prometheus.
If you prefer to reuse an existing Grafana Agent deployment, configure an integration pipeline with the same URL and credentials.
4. Import the Supabase dashboard#
- Open your Grafana Cloud dashboard list and click New → Import.
- Paste the raw contents of
supabase-grafana/dashboard.json. - When prompted for the datasource, choose the Prometheus instance that receives the Supabase metrics.
This dashboard includes 200+ charts grouped by CPU, IO, connections, replication, WAL, and bloat indicators.
5. Configure alerts (optional)#
The docs/example-alerts.md file contains suggested alert rules (disk saturation, long-running queries, replication lag, etc.). Import the alert rules into Grafana Cloud’s Alerting UI or translate them into Grafana Cloud’s managed alert rule format.
6. Troubleshooting#
- Metrics missing? Ensure the Grafana Cloud agent can reach
https://<project-ref>.supabase.coand that the selected Secret API key is still valid. - 401 errors? Create/rotate a Secret API key in Project Settings → API Keys and update the Grafana Cloud credentials.
- Long scrape durations? Reduce label cardinality in your Grafana queries or lower the time range to focus on recent data.