Logging
The Supabase Platform includes a Logs Explorer that allows log tracing and debugging. Log retention is based on your project's pricing plan. For details on how Logs usage is billed, see Manage Logs usage.
Product logs#
Supabase provides a logging interface specific to each product. You can use regular expressions for keywords and patterns to search log event messages. You can also export and download the log events matching your query as a spreadsheet.
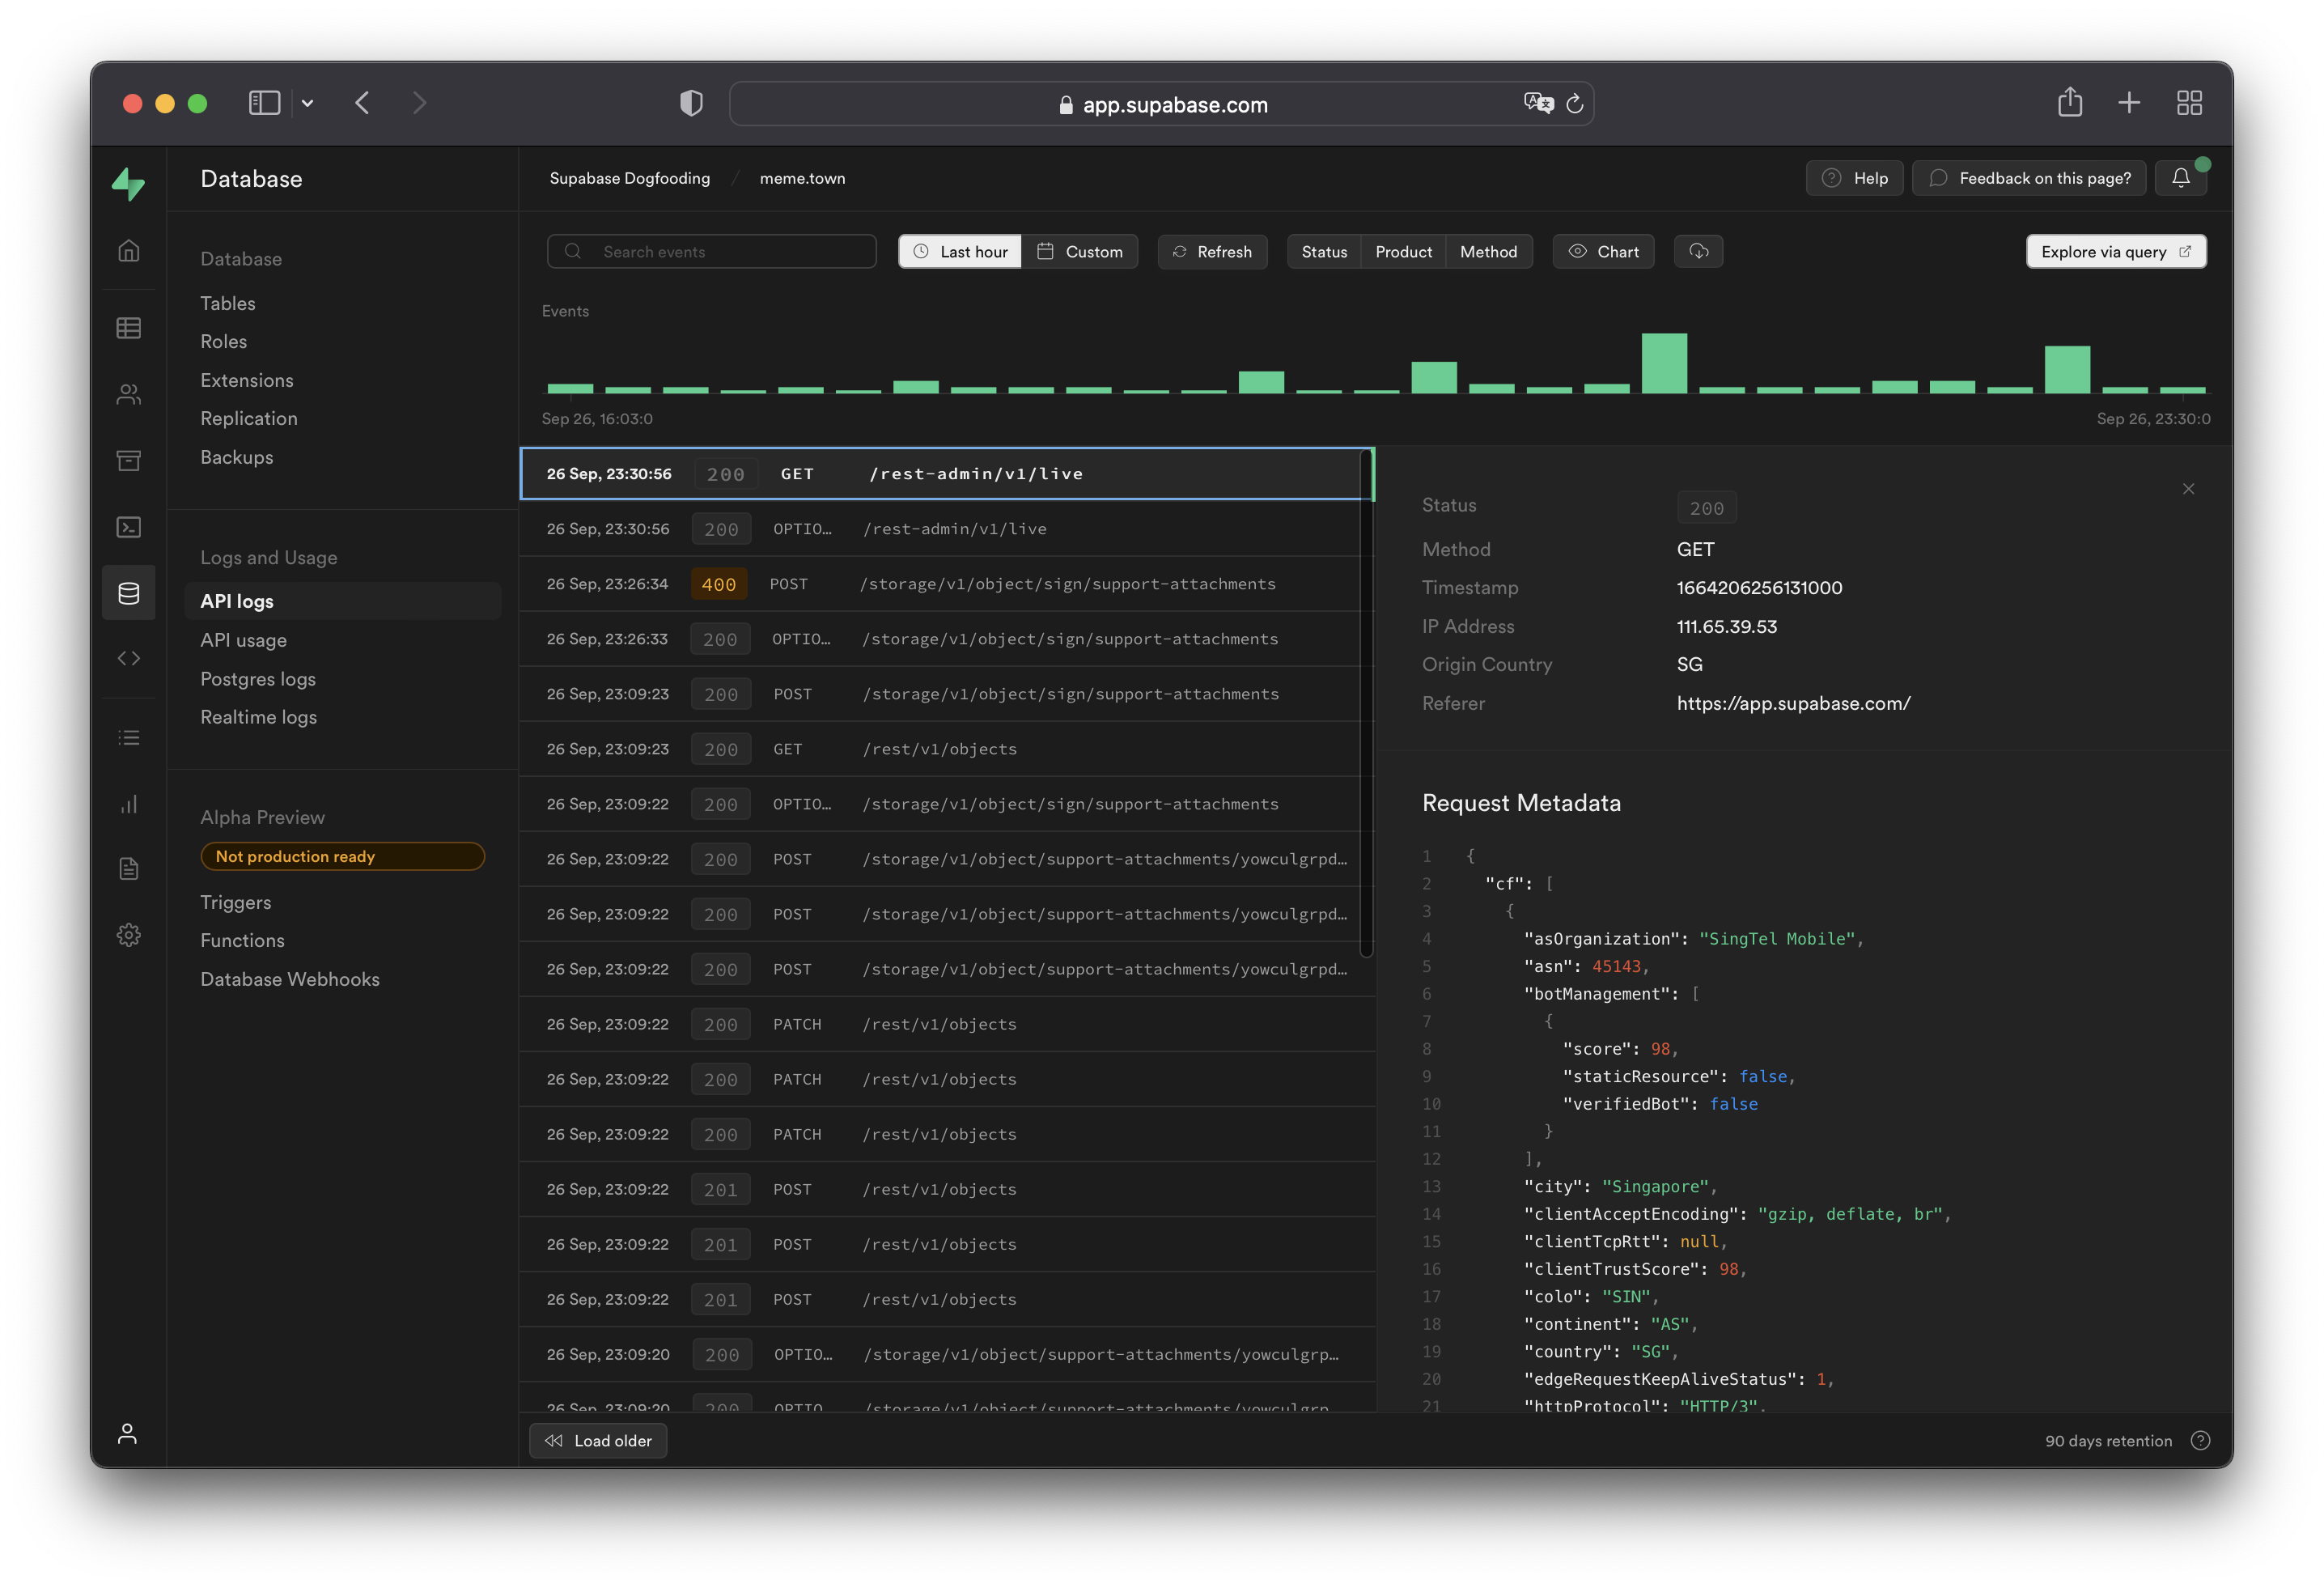
API logs show all network requests and response for the REST and GraphQL APIs. If Read Replicas are enabled, logs are automatically filtered between databases as well as the API Load Balancer endpoint. Logs for a specific endpoint can be toggled with the Source button on the upper-right section of the dashboard.
When viewing logs originating from the API Load Balancer endpoint, the upstream database or the one that eventually handles the request can be found under the Redirect Identifier field. This is equivalent to metadata.load_balancer_redirect_identifier when querying the underlying logs.
Working with API logs#
API logs run through the Cloudflare edge servers and will have attached Cloudflare metadata under the metadata.request.cf.* fields.
Allowed headers#
A strict list of request and response headers are permitted in the API logs. Request and response headers will still be received by the server(s) and client(s), but will not be attached to the API logs generated.
Request headers:
acceptcf-connecting-ipcf-ipcountryhostuser-agentx-forwarded-protoreferercontent-lengthx-real-ipx-client-infox-forwarded-user-agentrangeprefer
Response headers:
cf-cache-statuscf-raycontent-locationcontent-rangecontent-typecontent-lengthdatetransfer-encodingx-kong-proxy-latencyx-kong-upstream-latencysb-gateway-modesb-gateway-version
Additional request metadata#
To attach additional metadata to a request, it is recommended to use the User-Agent header for purposes such as device or version identification.
For example:
1node MyApp/1.2.3 (device-id:abc123)2Mozilla/5.0 (Windows NT 6.1; Win64; x64; rv:47.0) Gecko/20100101 Firefox/47.0 MyApp/1.2.3 (Foo v1.3.2; Bar v2.2.2)Do not log Personal Identifiable Information (PII) within the User-Agent header, to avoid infringing data protection privacy laws. Overly fine-grained and detailed user agents may allow fingerprinting and identification of the end user through PII.
Logging Postgres connections#
Postgres can log connection lifecycle events to your project's Postgres logs, for example when a client connects or authenticates. By default, Supabase sets log_connections to off for new projects and you must enable it first.
To enable connection logging for audit or compliance, see Postgres connection logging.
In the Logs Explorer, connection lifecycle messages may be hidden by default. Use the connection logs filter in the sidebar to show them.
Logging Postgres queries#
To enable query logs for other categories of statements:
- Enable the pgAudit extension.
- Configure
pgaudit.log(see below). Perform a fast reboot if needed. - View your query logs under Logs > Postgres Logs.
Configuring pgaudit.log#
The stored value under pgaudit.log determines the classes of statements that are logged by pgAudit extension. Refer to the pgAudit documentation for the full list of values.
To enable logging for function calls/do blocks, writes, and DDL statements for a single session, execute the following within the session:
1-- temporary single-session config update2set pgaudit.log = 'function, write, ddl';To permanently set a logging configuration (beyond a single session), execute the following, then perform a fast reboot:
1-- equivalent permanent config update.2alter role postgres set pgaudit.log to 'function, write, ddl';To help with debugging, we recommend adjusting the log scope to only relevant statements as having too wide of a scope would result in a lot of noise in your Postgres logs.
Note that in the above example, the role is set to postgres. To log user-traffic flowing through the HTTP APIs powered by PostgREST, set your configuration values for the authenticator.
1-- for API-related logs2alter role authenticator set pgaudit.log to 'write';By default, the log level will be set to log. To view other levels, run the following:
1-- adjust log level2alter role postgres set pgaudit.log_level to 'info';3alter role postgres set pgaudit.log_level to 'debug5';Note that as per the pgAudit log_level documentation, error, fatal, and panic are not allowed.
To reset system-wide settings, execute the following, then perform a fast reboot:
1-- resets stored config.2alter role postgres reset pgaudit.logIf any permission errors are encountered when executing alter role postgres ..., it is likely that your project has yet to receive the patch to the latest version of supautils, which is currently being rolled out.
RAISEd log messages in Postgres#
Messages that are manually logged via RAISE INFO, RAISE NOTICE, RAISE WARNING, and RAISE LOG are shown in Postgres Logs. Note that only messages at or above your logging level are shown. Syncing of messages to Postgres Logs may take a few minutes.
If your logs aren't showing, check your logging level by running:
1show log_min_messages;Note that LOG is a higher level than WARNING and ERROR, so if your level is set to LOG, you will not see WARNING and ERROR messages.
Limits and caveats#
- Postgres log events on the Supabase Platform are limited to 100,000 characters. If a log event exceeds this limit, it will be truncated. This does not apply to self-hosting.
- Internal connection logs to Postgres within the Supabase Platform by internal services are not logged. This does not apply to self-hosting.
Logging realtime connections#
Realtime doesn't log new WebSocket connections or Channel joins by default. Enable connection logging per client by including an info log_level parameter when instantiating the Supabase client.
1import { createClient } from '@supabase/supabase-js'23const options = {4 realtime: {5 params: {6 log_level: 'info',7 },8 },9}10const supabase = createClient('https://xyzcompany.supabase.co', 'sb_publishable_...', options)Logs Explorer#
The Logs Explorer exposes logs from each part of the Supabase stack as a separate table that can be queried and joined using SQL.
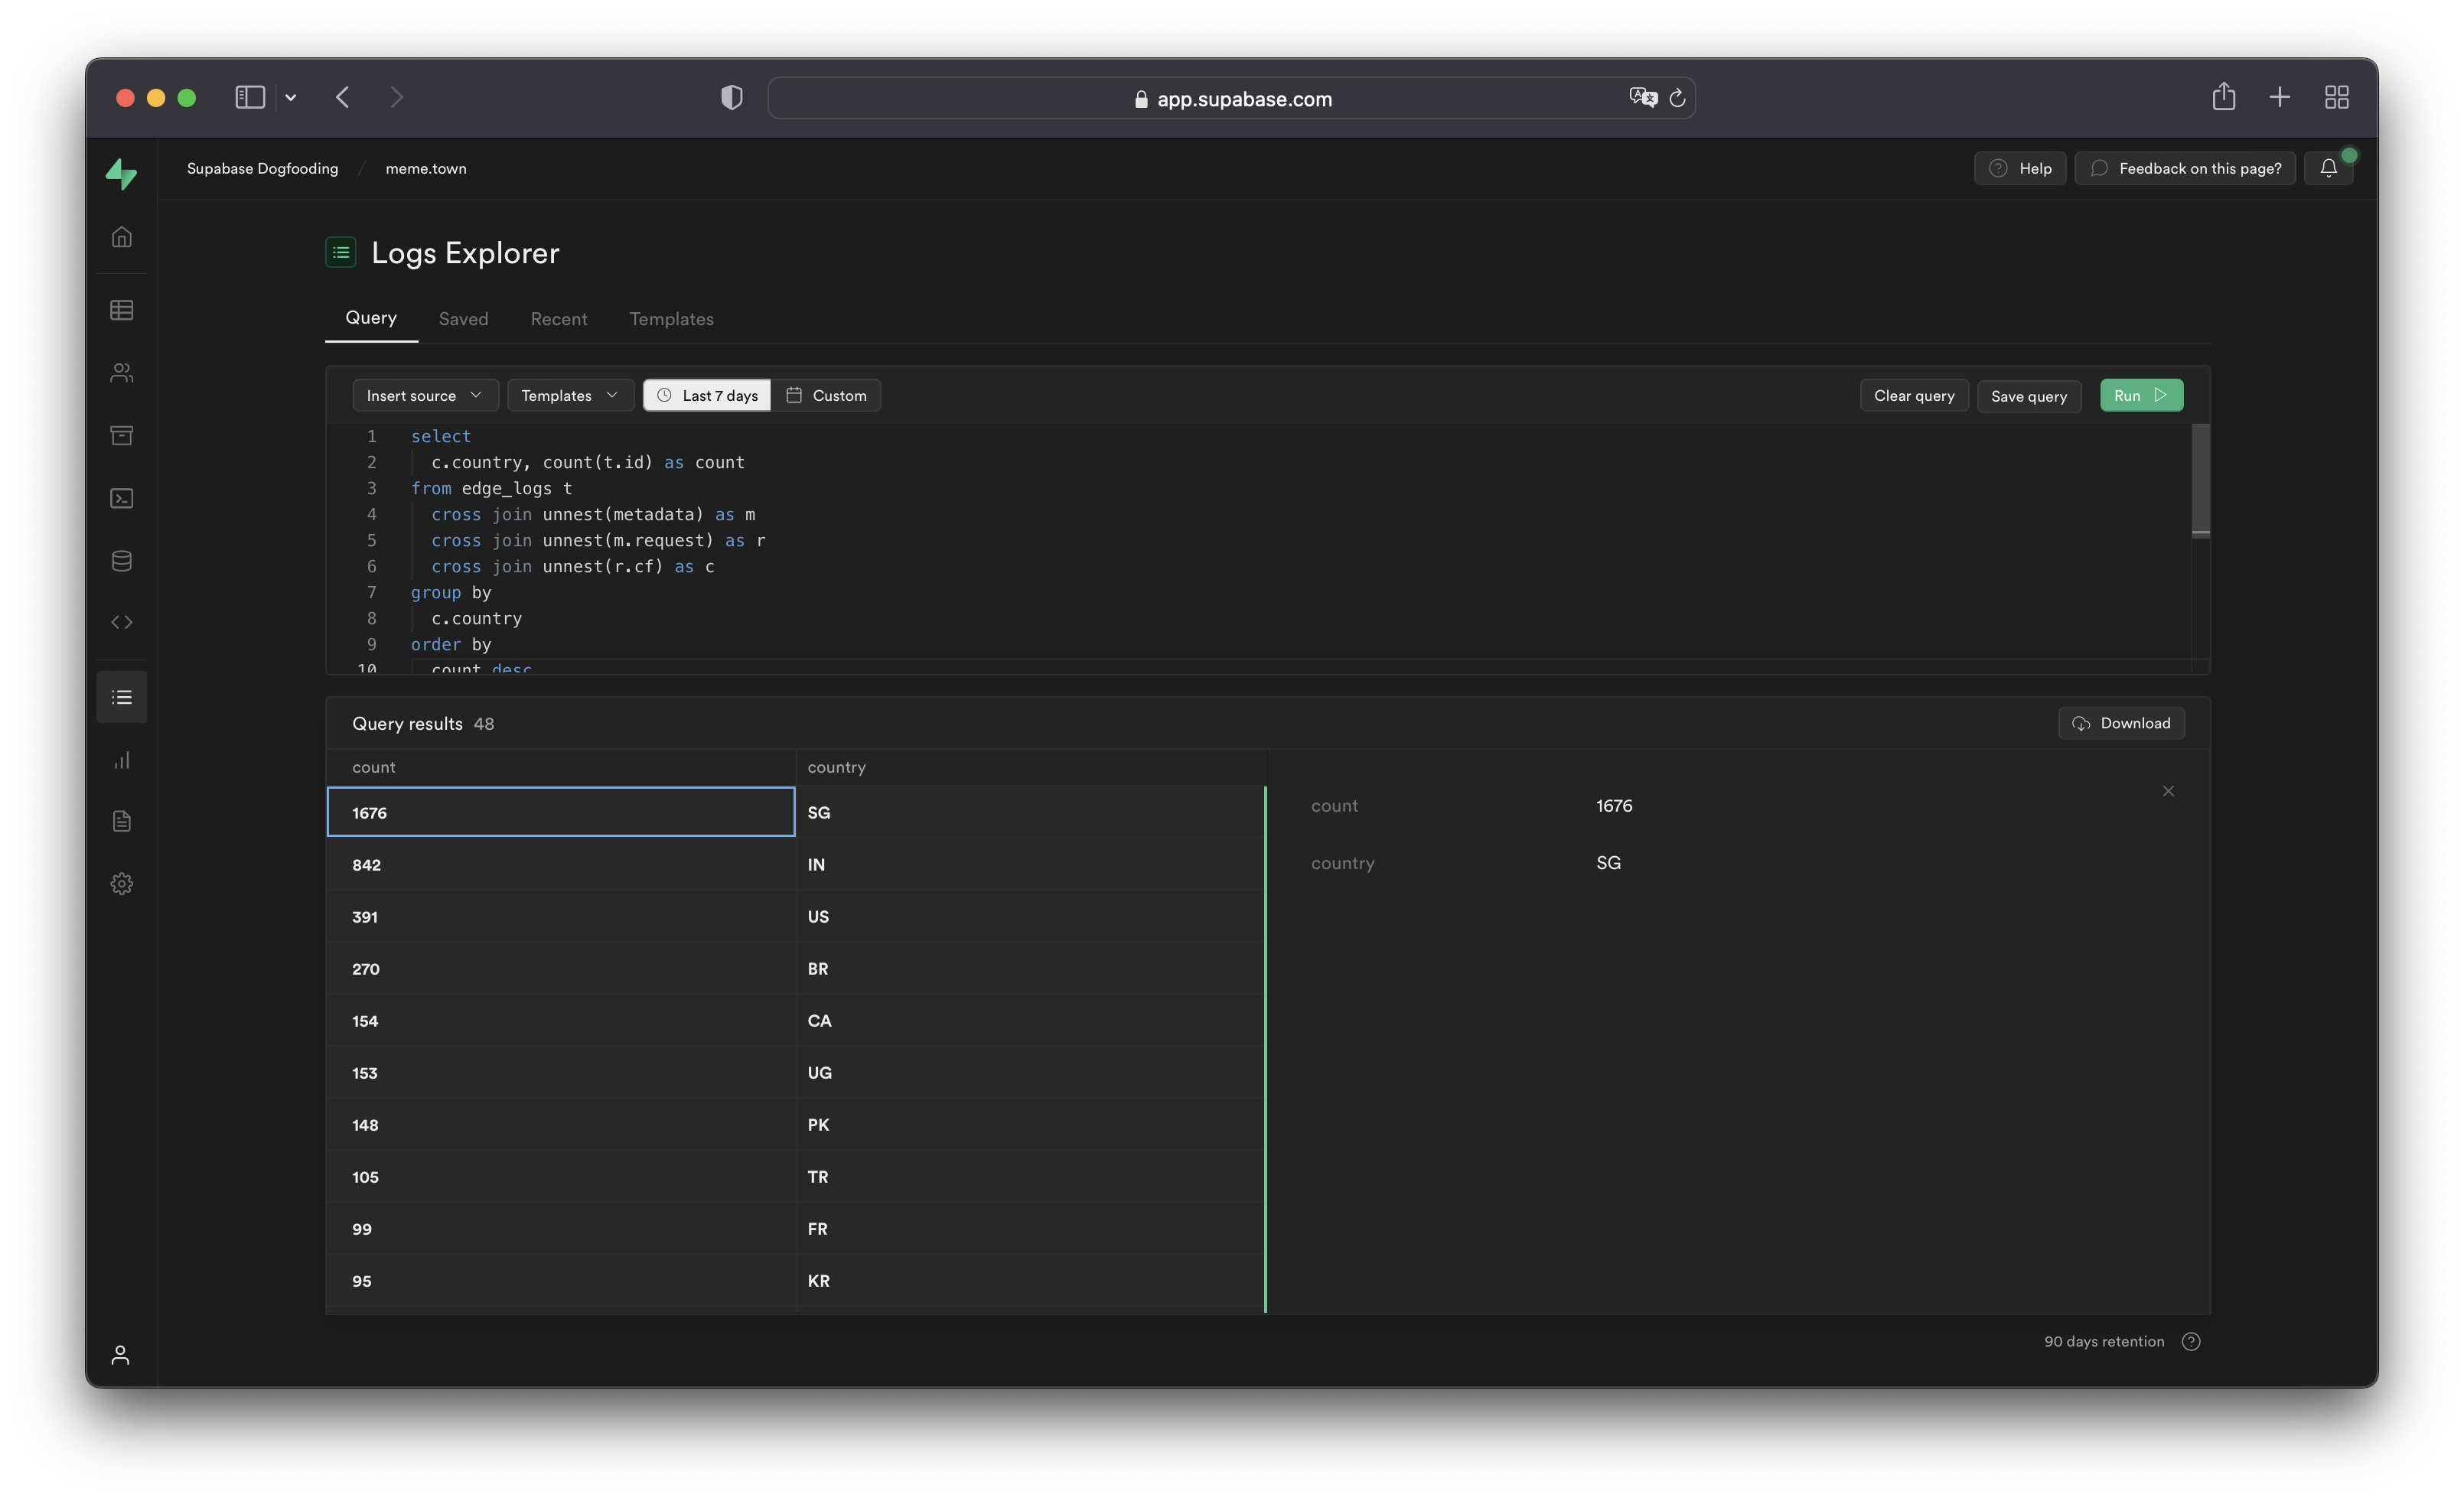
You can access the following logs from the Sources drop-down:
auth_logs: GoTrue server logs, containing authentication/authorization activity.edge_logs: Edge network logs, containing request and response metadata retrieved from Cloudflare.function_edge_logs: Edge network logs for only edge functions, containing network requests and response metadata for each execution.function_logs: Function internal logs, containing anyconsolelogging from within the edge function.postgres_logs: Postgres database logs, containing statements executed by connected applications.realtime_logs: Realtime server logs, containing client connection information.storage_logs: Storage server logs, containing object upload and retrieval information.
Querying with the Logs Explorer#
The Logs Explorer runs on ClickHouse. Every log line from every source is a single row in the logs table, tagged by a source column. Structured fields live in a log_attributes map whose values are strings, and the raw line is in event_message.
ClickHouse has been the default engine since June 2026. Projects created before this date use BigQuery, whose cross join unnest(metadata) syntax is deprecated. We recommend rewriting those queries in the ClickHouse syntax shown in this guide.
Read fields with bracket access, keeping the full dotted key, for example log_attributes['request.path'] rather than path. Wrap numeric values in toInt32OrZero(...), which returns 0 for a missing or non-numeric value. Use count() rather than count(*).
For example, to find failing API requests:
1select timestamp,2 toInt32OrZero(log_attributes['response.status_code']) as status,3 log_attributes['request.path'] as path4from logs5where source = 'edge_logs'6 and toInt32OrZero(log_attributes['response.status_code']) >= 4007order by timestamp desc8limit 100;For example, to find a specific Postgres SQLSTATE (42501 permission denied, 42P01 relation missing, 23505 duplicate key):
1select timestamp, log_attributes['parsed.user_name'] as role, event_message2from logs3where source = 'postgres_logs'4 and log_attributes['parsed.sql_state_code'] = '42501'5order by timestamp desc6limit 100;Do not guess log_attributes keys. A missing key returns an empty string rather than an error, so a wrong key makes a working query look empty instead of failing. Discover the real keys for a source, or read event_message, which always holds the full line. Statement text and error detail live there, not in parsed.query or parsed.detail, which are usually empty:
1select arrayJoin(mapKeys(log_attributes)) as key, count() as n2from logs3where source = 'postgres_logs'4group by key5order by n desc6limit 100;If you use the Supabase MCP server, the query_logs tool runs a custom ClickHouse query like the ones above on hosted projects. The get_logs tool returns a service's recent logs without SQL; it is deprecated on hosted projects in favor of query_logs, and remains the option for local and self-hosted projects.
LIMIT and result row limitations#
The Logs Explorer has a maximum of 1000 rows per run. Use LIMIT to optimize your queries by reducing the number of rows returned further.
Best practices#
- Include a filter over the timestamp.
Querying your entire log history might seem appealing. For Enterprise customers that have a large retention range, you run the risk of timeouts due additional time required to scan the larger dataset.
- Avoid selecting large nested objects; select individual values instead.
When querying large objects, the columnar storage engine selects each column associated with each nested key, resulting in a large number of columns being selected. This inadvertently impacts the query speed and may result in timeouts or memory errors, especially for projects with a lot of logs.
Instead, select only the values required.
1-- ❌ Avoid this: selecting the whole attributes map2select timestamp, log_attributes3from logs4where source = 'edge_logs';56-- ✅ Do this: select only the keys you need7select timestamp, log_attributes['request.method'] as method8from logs9where source = 'edge_logs';- Query one source at a time.
Identify which service owns the problem from the error or status code first, then query only that source. Scanning every source at once buries the signal you need and scans far more data than the investigation requires.
-
Follow a request across sources with an anchor. Once a query gives you an anchor such as a timestamp, request id, or SQL state, filter the adjacent source by that anchor to correlate the request across layers (for example
edge_logstopostgres_logs), instead of re-scanning each source from scratch. -
Reference only fields you have confirmed.
A misspelled or non-existent field name either errors or silently returns nothing, which leaves a working query look empty. Confirm field names in the field reference, or select event_message and inspect a sample row first.
Logs field reference#
Refer to the full field reference for each source below. Each source's structured fields are listed as ClickHouse log_attributes keys, alongside the base columns (id, timestamp, event_message, severity_text, source) that every source has.
| Path | Type |
|---|---|
| id | string |
| timestamp | datetime |
| event_message | string |
| severity_text | string |
| source | string |
| log_attributes['identifier'] | string |
| log_attributes['load_balancer_redirect_identifier'] | string |
| log_attributes['request.cf.asOrganization'] | string |
| log_attributes['request.cf.asn'] | number |
| log_attributes['request.cf.botManagement.corporateProxy'] | boolean |
| log_attributes['request.cf.botManagement.detectionIds'] | number[] |
| log_attributes['request.cf.botManagement.ja3Hash'] | string |
| log_attributes['request.cf.botManagement.score'] | number |
| log_attributes['request.cf.botManagement.staticResource'] | boolean |
| log_attributes['request.cf.botManagement.verifiedBot'] | boolean |
| log_attributes['request.cf.city'] | string |
| log_attributes['request.cf.clientTcpRtt'] | number |
| log_attributes['request.cf.clientTrustScore'] | number |
| log_attributes['request.cf.colo'] | string |
| log_attributes['request.cf.continent'] | string |
| log_attributes['request.cf.country'] | string |
| log_attributes['request.cf.edgeRequestKeepAliveStatus'] | number |
| log_attributes['request.cf.httpProtocol'] | string |
| log_attributes['request.cf.latitude'] | string |
| log_attributes['request.cf.longitude'] | string |
| log_attributes['request.cf.metroCode'] | string |
| log_attributes['request.cf.postalCode'] | string |
| log_attributes['request.cf.region'] | string |
| log_attributes['request.cf.timezone'] | string |
| log_attributes['request.cf.tlsCipher'] | string |
| log_attributes['request.cf.tlsClientAuth.certPresented'] | string |
| log_attributes['request.cf.tlsClientAuth.certRevoked'] | string |
| log_attributes['request.cf.tlsClientAuth.certVerified'] | string |
| log_attributes['request.cf.tlsExportedAuthenticator.clientFinished'] | string |
| log_attributes['request.cf.tlsExportedAuthenticator.clientHandshake'] | string |
| log_attributes['request.cf.tlsExportedAuthenticator.serverFinished'] | string |
| log_attributes['request.cf.tlsExportedAuthenticator.serverHandshake'] | string |
| log_attributes['request.cf.tlsVersion'] | string |
| log_attributes['request.headers.cf_connecting_ip'] | string |
| log_attributes['request.headers.cf_ipcountry'] | string |
| log_attributes['request.headers.cf_ray'] | string |
| log_attributes['request.headers.host'] | string |
| log_attributes['request.headers.referer'] | string |
| log_attributes['request.headers.x_client_info'] | string |
| log_attributes['request.headers.x_forwarded_proto'] | string |
| log_attributes['request.headers.x_real_ip'] | string |
| log_attributes['request.host'] | string |
| log_attributes['request.method'] | string |
| log_attributes['request.path'] | string |
| log_attributes['request.protocol'] | string |
| log_attributes['request.search'] | string |
| log_attributes['request.url'] | string |
| log_attributes['response.headers.cf_cache_status'] | string |
| log_attributes['response.headers.cf_ray'] | string |
| log_attributes['response.headers.content_location'] | string |
| log_attributes['response.headers.content_range'] | string |
| log_attributes['response.headers.content_type'] | string |
| log_attributes['response.headers.date'] | string |
| log_attributes['response.headers.sb_gateway_version'] | string |
| log_attributes['response.headers.transfer_encoding'] | string |
| log_attributes['response.headers.x_kong_proxy_latency'] | string |
| log_attributes['response.origin_time'] | number |
| log_attributes['response.status_code'] | number |